- from a rising concern that benefits of economic growth have not been equitably shared
- Eleventh FYP (2007-2012) defines inclusive growth as a growth process which yields broad based benefits and ensures equality of opportunity for all
When is growth inclusive?
Summary
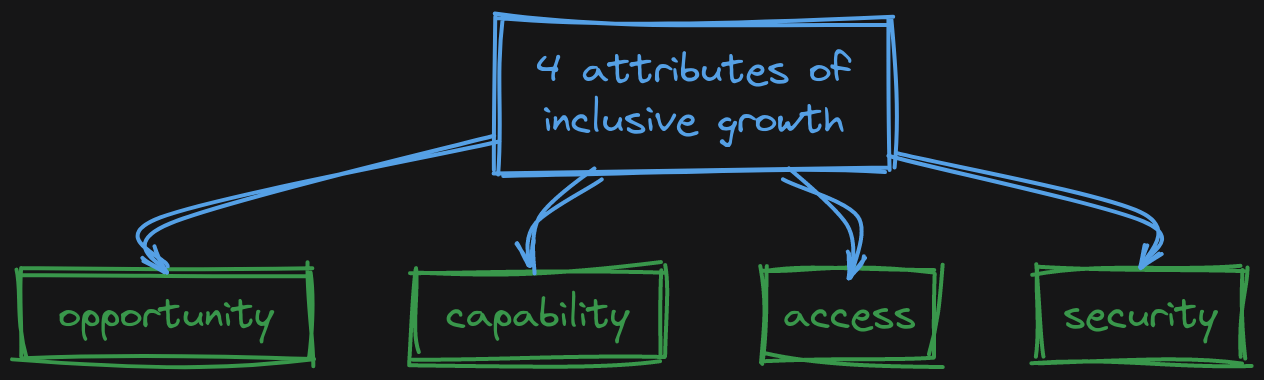
Must ensure equality of opportunity and participation in growth by all with special focus on most vulnerable people of society.
Growth is inclusive when
- it takes place in sectors where poor work
- eg. agriculture
- occurs in places where poor live
- eg. underdeveloped areas
- uses factors of production that poor posses
- eg. unskilled labour
- reduces prices of consumption items that poor consume
- eg. food, fuel, clothing
Analysis
- long term perspective
- focus on productive employment
- no focus on direct income redistribution
- income redistribution is a side effect but not a goal
- inclusive growth is meant to be inherently sustainable as distinct from income distribution schemes
- may make poverty reduction efforts
Features as per World Bank
- long term perspective
- for growth to be sustained in long term, it must be broad based across sectors. Structural transformation for economic diversification is imp.
- also be inclusive of large part of country’s labour force
- focus on both pace and pattern of growth
- focus on productive employment rather than income redistribution
- in line with absolute definition of pro-poor growth, not the relative one
Need for inclusive growth
- LPG Reforms accelerated India’s growth rate but this growth bypasses a large section of people
- people living in villages
- women, children
- backward castes
- minorities
- faulty approaches and politically motivated policies, growth has generated inequalities
- lot of growth is concentrated in service sector which isn’t accessible by major chunk of population (due to demands of highly skilled labour)
- acc to former PM Manmohan Singh, we need a rural first approach by investing in rural finance, credit, employment, infrastructure
Major Concerns
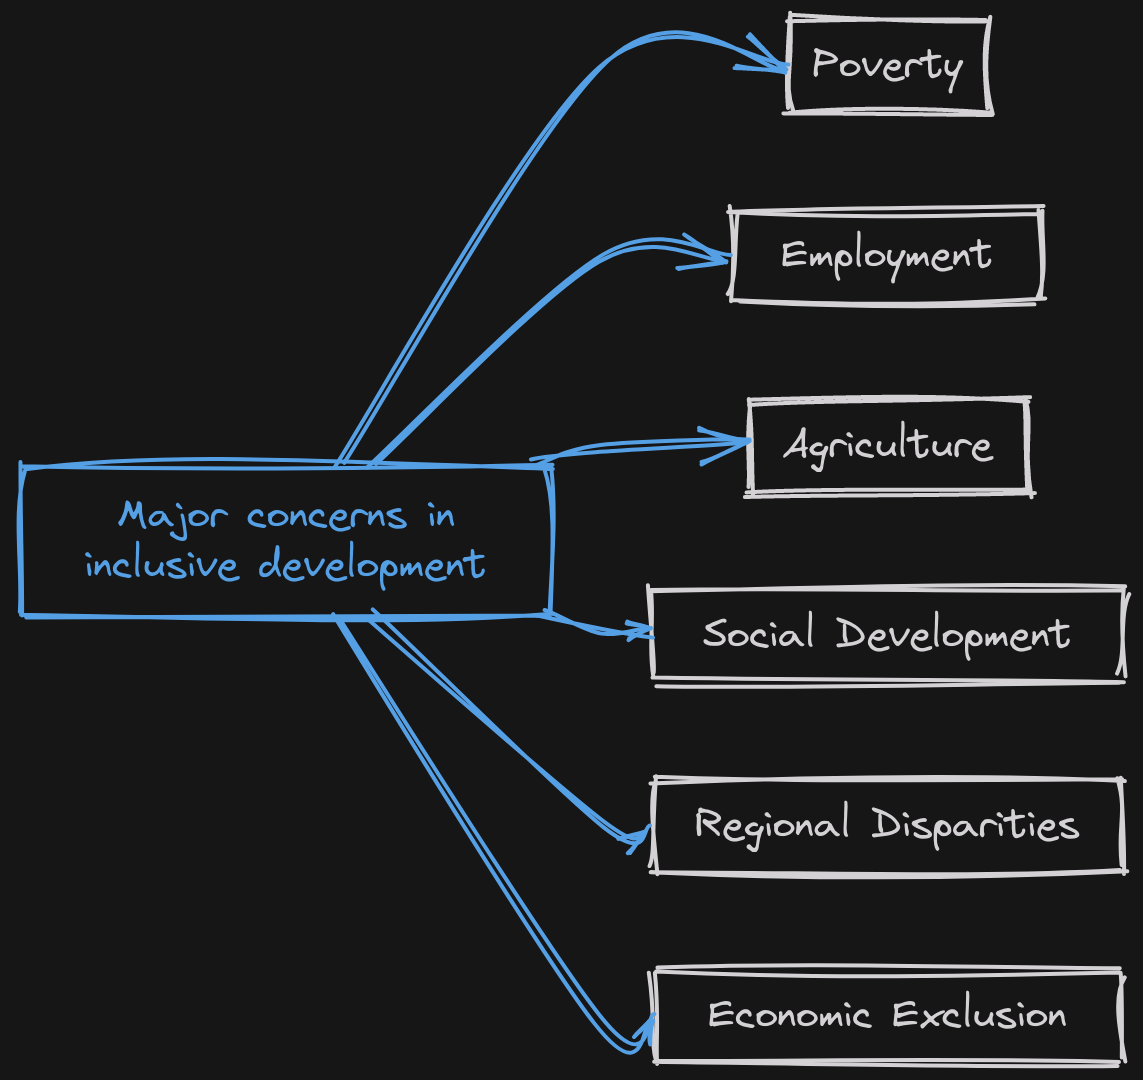
Point Wise Description
- Poverty
- India has 30% population below poverty line (acc to Rangrajan committee)
- they lack edu and skills to be employed in formal job
- Employment
- low quantity and quality of employment in india due to illiteracy and over dependency on agri employment
- 90% population in unorganized sector
- low wages
- no social security
- Agriculture 🚜
- 43% population in agri, but contributing only 16% GDP
- low wages and productivity
- disguised unemployment
- fragmented land holdings, monsoon dependent
- Social Development
- low level of public expenditure on health🏥
- poor quality of primary educational institution
- significant gender disparities
- malnutrition
- Regional Disparities
- some regions developed fast
- Kerala boasts highest female literacy and best sex ratio
- Punjab per capita income Bihar per capita income 😔
- Other Issues due to economic exclusion
- increased crimes in society
- naxalism
Non farm Unorganized Sector
- rural and poor population is often identified with agri sector
- however, it is the unorganized non farm sector that is absorbing most of the labour force
- this sector has high potential for growth if adequate investments and market linking is done
On the poor by Prof. C K Prahalad
If we stop thinking of the poor as victims or as a burden, and start recognising them as resilient and creative entrepreneurs and value conscious consumers, a whole world of opportunity will open up.
Inclusive growth
Poverty estimation
World Bank definition
Extreme poverty = people living on less than $1.9/day (in PPP exchange rate)
- growth not sole objective of economic policy
- eradication of poverty also highly imp
- Dadabhai Naoroji first to discuss concept of poverty line in pre independent india
- experts like Prof. DT Lakdawala, Prof. Suresh D Tendulkar, C Rangarajan etc have used consumption expenditure from sample surveys of NSSO to estimate number of poor
- eg. as per Tendulkar report, if people are spending Rs. 27/day in rural area or Rs. 33 in urban area, then they’re BPL
- led to cut off of 21.9% of population as BPL in 2011-12
- C Rangarajan raised limits to Rs. 32 (rural) and Rs. 47 (urban) to arrive at 29.5% population cut off
SECC 2011 Census
Summary
Identified welfare scheme eligible households via indicators of multi dimensional poverty. Data used to identify beneficiaries for PMAY-G, Deendayal Antyodaya Yojna, PMJAY, Ujjwala Yojna and by state govts to implement NFSA.
For the fist time, allowed tracking deprivation of households and address gaps with focus on multi-dimensional poverty. Sumit Bose Committee 2017 recommended using SECC 2011 data to identify beneficiaries for govt schemes.
Ranked households in 3 categories
- Automatically Excluded: satisfying any of the 13 asset or income based parameters
- eg. a parameter is if any household member is govt employee, then household automatically excluded from welfare benefits
- Automatically Included: satisfying one of the 5 acute social destitution criteria
- households without shelter
- destitute living on alms
- manual scavenger
- primitive tribal groups
- bonded labour
- Others: ranked on basis of 7 indicators to determine whether eligible for welfare benefits
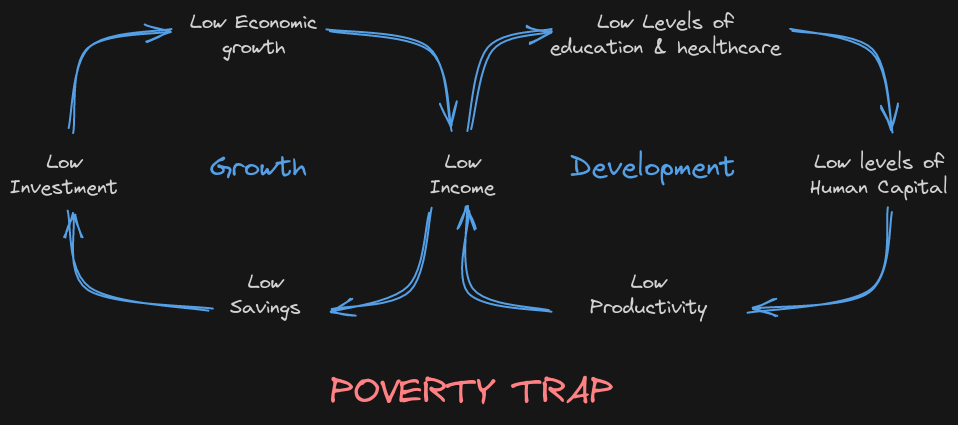
Poverty Trap
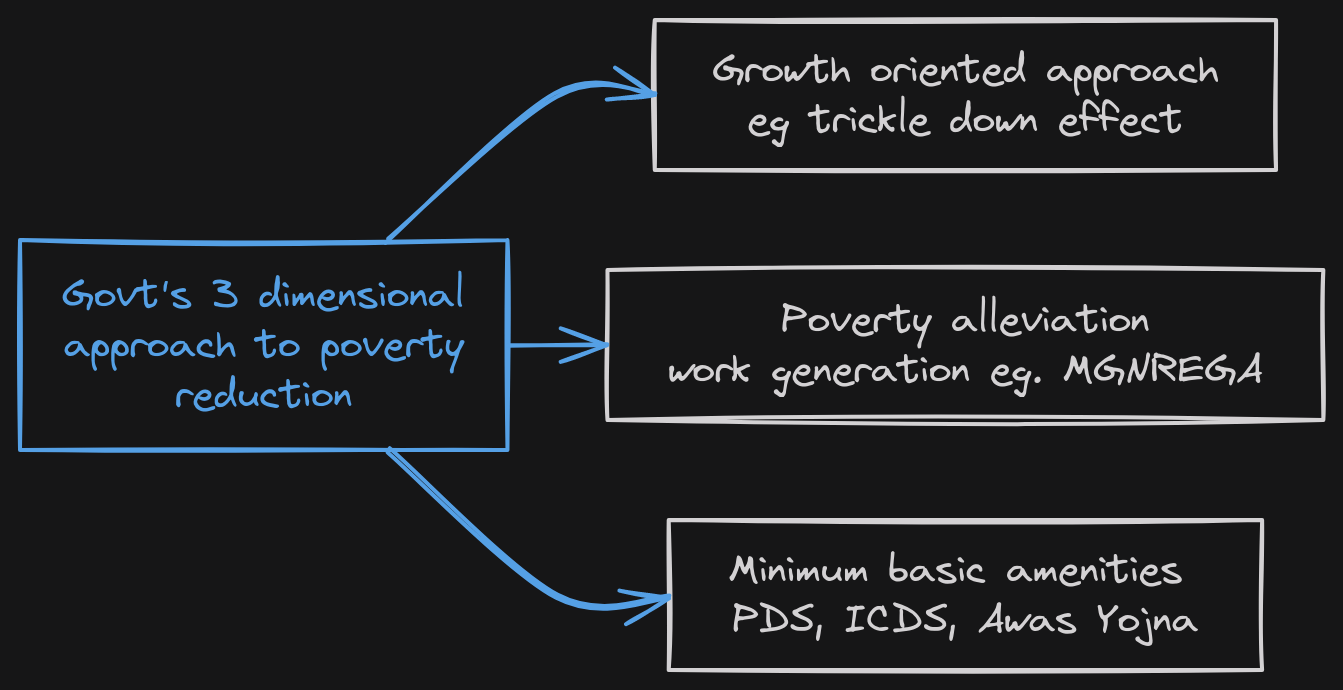
Government’s 3 dimensional approach to poverty reduction
Poverty Eradication
- poverty 66% when brits left
- 2011-12: 29.5% (recall Rangarajan Report)
- but number wise, more people in poverty as compared to independence era (33cr at time of independence vs 36cr in 2011-12)
- due to population burst
- many govt poverty eradication schemes have been palliative
- schemes failed to go to the root of poverty i.e. capability deprivation that leaves individual unable to earn sufficient income through work or entrepreneurship
- income poverty is only a manifestation of a larger deprivation from health, education, water, sanitation, public infrastructure etc
- Rather than Universal basic Income, we need Universal Basic Services
Demographic Dividend
- India’s demographic cycle is 10-30 years behind other countries like China, Korea etc
Recent Trends
- Total Fertility Rate declined to 2.0, but still +ve population growth for 2 decades due to
- population momentum (many young women will enter reproductive age)
- rise in life expectancy
- population growth in India slowing in recent decades
- annual growth rate 2.5% during 1971-81
- 1% in 2020s
- share of india’s young (0-19 yr) started declining
- projected to drop to 25% by 2041
- share of elderly rising
- inc to 16% by 2041
- working age (20-59 yr) population will inc thru 2041. Demographic dividend will peak around 2041, when share of working age population is expected to hit 59%
Income Inequality
- spectacular income growth in past 3 decades (i.e. after LPG Reforms)
- but growth concentrated in service sector 😢
- 7% growth rate b/w 1990-2019
- indian economy 3rd largest in world
- but benefits not uniformly distributed
Stats?
- 2014: top 1% population has
- 22% national income
- 60% wealth
- Gini coefficient in 2011-12
- consumption: 0.36
- income: 0.55
- wealth: 0.74
- i.e. while the differences in consumption are relatively moderate, the difference in income and especially wealth accumulation are very high
How to reduce inequality?
- public investment in physical and social infrastructure
- redistribution of wealth (not a pragmatic solution tho)
- eradication of corruption
- electoral reforms
- fixing crony capitalism
- regulating election funding
- focus on delivery of public services
- target over all economic growth and then pray for trickle down mathematics to work
Socio Economic Indicators
Lorenz Curve & Gini Coefficient
- represents inequality
- higher more inequality
- range is 0-1 (i.e. decimal values incl)
- might be represented in percentage too
Kuznets Curve
- graphs economic inequality against per capita income
Human Development Index
- developed by Amartya Sen
- based on 3 parameters
- standard of living (measured by gross national income per capita)
- health, measured by life expectancy at birth
- education, measured by expected years of schooling for child and mean years of schooling for adult aged 25 or more
Other related topics
Labour Laws
refer: Labour Laws in India
Migrant Workers
refer: Migrant Labour
EPFO
refer: Employee Provident Fund Organization
NPS
refer: New Pension Scheme (NPS)